from pathlib import Path# Look for test datatest_data_dir = Path('../test_data')if test_data_dir.exists():print("Test data directory found!")print(f"\nContents:")for item insorted(test_data_dir.iterdir()):if item.is_file(): size_mb = item.stat().st_size /1024/1024print(f" {item.name}: {size_mb:.2f} MB")elif item.is_dir(): n_files =len(list(item.glob('*')))print(f" {item.name}/: {n_files} files")else:print("Test data directory not found. Run create_test_data.sh to generate test data.")
Create sidecar in memory using the process_partition function
Code
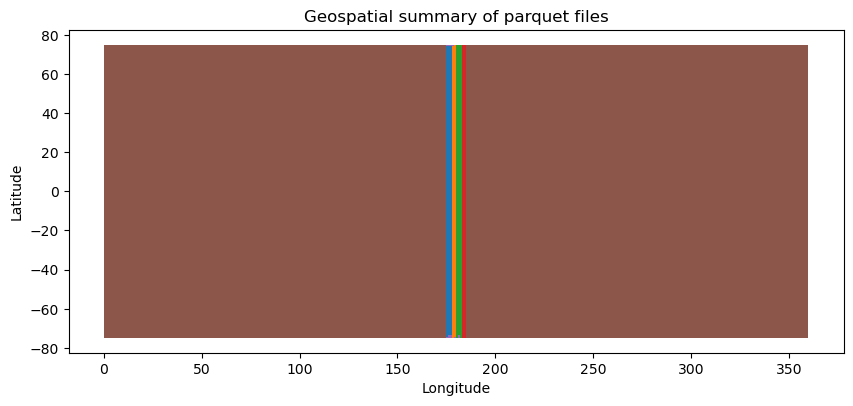
# Create sidecar in memory using the process_partition functionfrom healpyxel.sidecar import process_partition# Parametersnside =32# HEALPix resolutionmode ='fuzzy'# 'fuzzy' allows multiple cells per geometry, 'strict' only single-cell geometries# Process the GeoDataFramesidecar_df = process_partition( gdf=gdf, nside=nside, mode=mode, base_index=0, # Start source_id from 0 lon_convention='0_360', # Use '0_360' or '-180_180' (underscores, not hyphens!))print(f"Created sidecar with {len(sidecar_df)} assignments")print(f"Unique geometries: {sidecar_df['source_id'].nunique()}")print(f"Unique HEALPix cells: {sidecar_df['healpix_id'].nunique()}")print(f"\nSidecar columns: {list(sidecar_df.columns)}")print(f"Sidecar dtypes:\n{sidecar_df.dtypes}")# Show first few assignmentssidecar_df.head(10)
2026-02-05 17:06:31,997 INFO Partition (lon_convention=0_360): processed 50000 geometries, dropped 12 (0.0%) total [pre-filter: 12, post-processing: 0]
Check how many cells each geometry touches (for fuzzy mode)
Assignment statistics:
  Min cells per geometry: 1
  Max cells per geometry: 4
  Mean cells per geometry: 1.10
  Median cells per geometry: 1

Distribution of assignments per geometry:
1    45331
2     4396
3      236
4       25
Name: count, dtype: int64
Saved sidecar to: /tmp/sample_50k_sidecar_nside32_fuzzy.parquet
File size: 441.63 KB
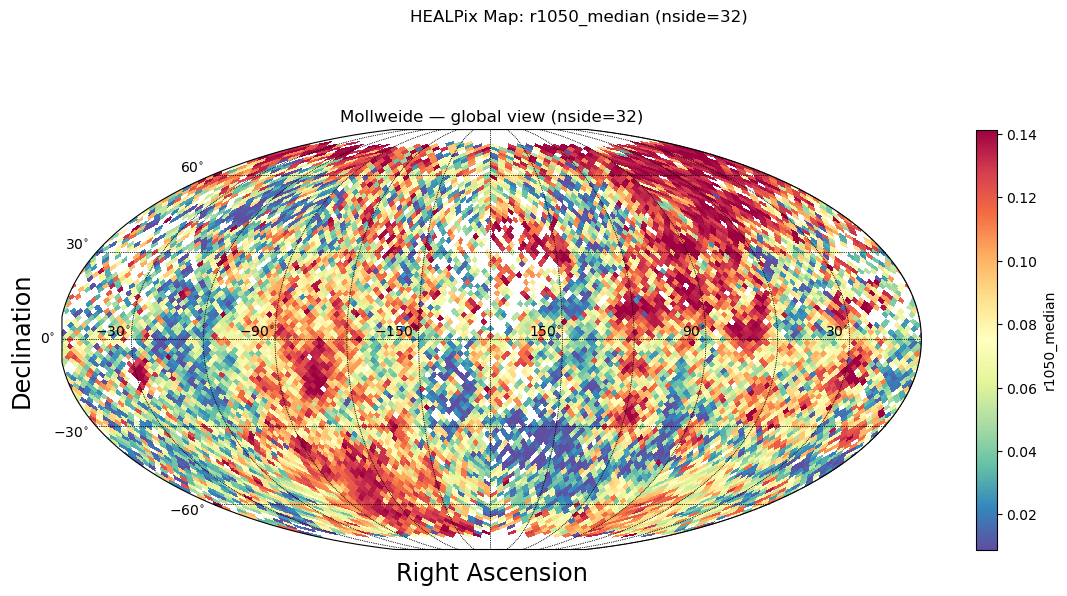
Aggregate Data by HEALPix Cells
Now let’s use the sidecar to aggregate the r1050 column from the original data by HEALPix cells.
✓ Column 'r1050' found in the data
  Range: [-0.050, 0.325]
  Missing values: 0 / 50000
Aggregate r1050 by HEALPix cells with explicit aggregation functions.
Convert GeoDataFrame to regular DataFrame for aggregation (geometry not needed)/
2026-02-05 17:06:32,336 INFO Creating source_id column from DataFrame index
2026-02-05 17:06:32,366 INFO Sidecar source_id overlap: 49988/49988 (100.0%)
2026-02-05 17:06:32,366 INFO Merging sidecar with original data
2026-02-05 17:06:32,371 INFO Grouping by healpix_id and computing aggregations
2026-02-05 17:06:32,437 INFO Processing 10860 HEALPix cells
2026-02-05 17:06:35,115 INFO Aggregation complete: 10860 cells with data
Aggregated data shape: (10860, 6)
Number of HEALPix cells with data: 10860

Aggregated columns: ['r1050_mean', 'r1050_median', 'r1050_std', 'r1050_mad', 'r1050_robust_std', 'n_sources']
r1050_mean
r1050_median
r1050_std
r1050_mad
r1050_robust_std
n_sources
healpix_id
0
0.048616
0.047857
0.003759
0.002672
0.003962
4
1
0.051467
0.052283
0.002976
0.001888
0.002799
6
2
0.049697
0.049118
0.003637
0.002289
0.003394
6
3
0.059066
0.063241
0.007149
0.001711
0.002537
3
4
0.051262
0.051523
0.006552
0.002510
0.003721
9
5
0.047092
0.047639
0.008176
0.003183
0.004719
7
6
0.058219
0.058195
0.002682
0.002040
0.003024
6
7
0.053656
0.054208
0.008577
0.006288
0.009323
8
8
0.037711
0.037711
0.008823
0.008823
0.013080
2
9
0.041094
0.041094
0.012205
0.012205
0.018096
2
Interpret the Results
Each row represents one HEALPix cell with: - healpix_id: The HEALPix cell identifier - r1050_mean: Mean of r1050 values in this cell - r1050_median: Median value (less affected by outliers) - r1050_std: Standard deviation (spread of values) - r1050_mad: Median Absolute Deviation (robust measure of spread) - r1050_robust_std: MAD * 1.4826 (approximates standard deviation for normal distributions) - n_sources: Number of source measurements in this cell, for all columns
Let’s examine the statistics of the aggregated data.
first, Display summary statistics of the aggregated results on HEALPix cells:
Check the distribution of source counts per HEALPix cell:
Cells with only 1 source: 1644
Cells with 2-5 sources: 5696
Cells with 5+ sources: 3520
n_sources
count
10860.000000
mean
5.058103
std
4.835600
min
1.000000
25%
2.000000
50%
4.000000
75%
6.000000
max
98.000000
HEALPix Metadata
The aggregation results don’t automatically include HEALPix metadata. You need to track this separately or read it from a saved sidecar file. For in-memory workflows, store metadata explicitly: